Physical Address
304 North Cardinal St.
Dorchester Center, MA 02124
Physical Address
304 North Cardinal St.
Dorchester Center, MA 02124

L’Analisi esplorativa dei dati in R evidenzia, tramite grafici ed indicatori sintetici, le caratteristiche di ciascun attributo presente in un dataset.
Selezioniamo un dataset di esempio tra quelli disponibili nel pacchetto R.
Per avere l’elenco basta digitare:
# elenco dei pacchetti disponibili
 data()
Puoi vedere la documentazione di data() per ulteriori dettagli.
In una finestra a parte, si apre un file di testo contenente l’elenco:
 Data sets in package ‘datasets’:
 AirPassengers Monthly Airline Passenger Numbers 1949-1960
 BJsales Sales Data with Leading Indicator
 BJsales.lead (BJsales) Sales Data with Leading Indicator
 BOD Biochemical Oxygen Demand
 CO2 Carbon Dioxide Uptake in Grass Plants
 ChickWeight Weight versus age of chicks on different diets
 DNase Elisa assay of DNase
 EuStockMarkets Daily Closing Prices of Major European Stock Indices, 1991-1998
 Formaldehyde Determination of Formaldehyde
 HairEyeColor Hair and Eye Color of Statistics Students
 Harman23.cor Harman Example 2.3
 Harman74.cor Harman Example 7.4
 Indometh Pharmacokinetics of Indomethaci
 …………………………………..
Prendiamo come esempio il dataset di nome iris. È un dataset multivariato introdotto da Ronald Fisher nel 1936. Consiste in 150 istanze di Iris misurate da Edgar Anderson e classificate secondo tre specie: Iris setosa, Iris virginica e Iris versicolor. Le quattro variabili considerate sono la lunghezza e la larghezza del sepalo e del petalo. A causa di errori, esistono diverse versioni del
dataset utilizzate nella letteratura scientifica.
Con
# maggiori informazioni sul dataset.
 help(iris)
Iniziamo l’Analisi esplorativa dei dati in R con alcune funzioni base.
dim(iris)
 [1] 150   5
names(iris)
 [1] "Sepal.Length" "Sepal.Width"  "Petal.Length" "Petal.Width"  "Species"
 > str(iris)
 'data.frame': 150 obs. of 5 variables:
 $ Sepal.Length: num 5.1 4.9 4.7 4.6 5 5.4 4.6 5 4.4 4.9 ...
 $ Sepal.Width : num 3.5 3 3.2 3.1 3.6 3.9 3.4 3.4 2.9 3.1 ...
 $ Petal.Length: num 1.4 1.4 1.3 1.5 1.4 1.7 1.4 1.5 1.4 1.5 ...
 $ Petal.Width : num 0.2 0.2 0.2 0.2 0.2 0.4 0.3 0.2 0.2 0.1 ...
 $ Species : Factor w/ 3 levels "setosa","versicolor",..: 1 1 1 1 1 1 1 1 1 1 ...
 > attributes(iris)
 $names
 [1] "Sepal.Length" "Sepal.Width" "Petal.Length" "Petal.Width" "Species"
 $class
 [1] "data.frame"
 $row.names
 [1] 1 2 3 4 5 6 7 8 9 10 11 12 13 14 15 16 17 18 19 20 21 22 23 24 25 26 27
 [28] 28 29 30 31 32 33 34 35 36 37 38 39 40 41 42 43 44 45 46 47 48 49 50 51 52 53 54
 [55] 55 56 57 58 59 60 61 62 63 64 65 66 67 68 69 70 71 72 73 74 75 76 77 78 79 80 81
 [82] 82 83 84 85 86 87 88 89 90 91 92 93 94 95 96 97 98 99 100 101 102 103 104 105 106 107 108
 [109] 109 110 111 112 113 114 115 116 117 118 119 120 121 122 123 124 125 126 127 128 129 130 131 132 133 134 135
 [136] 136 137 138 139 140 141 142 143 144 145 146 147 148 149 150
Per mostrase solo le prime 10 righe si usa iris[1:10,].
iris[1:10,]
 Sepal.Length Sepal.Width Petal.Length Petal.Width Species
 1           5.1         3.5          1.4         0.2  setosa
 2           4.9         3.0          1.4         0.2  setosa
 3           4.7         3.2          1.3         0.2  setosa
 4           4.6         3.1          1.5         0.2  setosa
 5           5.0         3.6          1.4         0.2  setosa
 6           5.4         3.9          1.7         0.4  setosa
 7           4.6         3.4          1.4         0.3  setosa
 8           5.0         3.4          1.5         0.2  setosa
 9           4.4         2.9          1.4         0.2  setosa
 10          4.9         3.1          1.5         0.1  setosa
Solo per la colonna Sepal.Length oppure iris$Sepal.Length[1:10]
iris[1:10, "Sepal.Length"]
 [1] 5.1 4.9 4.7 4.6 5.0 5.4 4.6 5.0 4.4 4.9
Distribuzione di ogni variabile abbiamo la funnzione summary().
summary(iris)
 Sepal.Length    Sepal.Width     Petal.Length    Petal.Width          Species
 Min.   :4.300   Min.   :2.000   Min.   :1.000   Min.   :0.100   setosa    :50
 1st Qu.:5.100   1st Qu.:2.800   1st Qu.:1.600   1st Qu.:0.300   versicolor:50
 Median :5.800   Median :3.000   Median :4.350   Median :1.300   virginica :50
 Mean   :5.843   Mean   :3.057   Mean   :3.758   Mean   :1.199
 3rd Qu.:6.400   3rd Qu.:3.300   3rd Qu.:5.100   3rd Qu.:1.800
 Max.   :7.900   Max.   :4.400   Max.   :6.900   Max.   :2.500
Frequenza
table(iris$Species)
 setosa versicolor  virginica
 50         50         50
Varianza
var(iris$Sepal.Length)
 [1] 0.6856935
Covarianza tra due variabili
cov(iris$Sepal.Length, iris$Petal.Length)
 [1] 1.274315
Correlazione tra due variabili
cor(iris$Sepal.Length, iris$Petal.Length)
 [1] 0.8717538
Graficamente abbiamo a disposizone
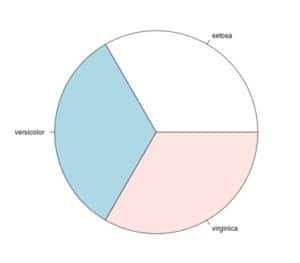
per un grafico a torta
pie(table(iris$Species))

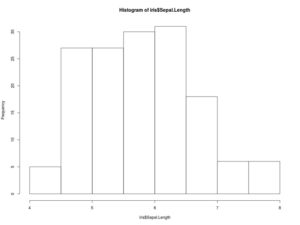
per un istogramma
hist(iris$Sepal.Length)

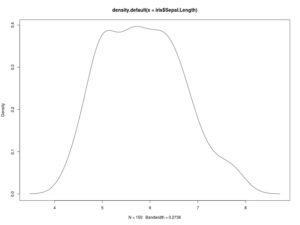
per la densità
plot(density(iris$Sepal.Length))

per i Grafici di dispersione
plot(iris$Sepal.Length, iris$Sepal.Width)
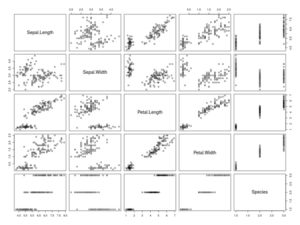
per lo scatter plot
plot(iris)
 #oppure
 pairs(iris)

Guarda tutti i tutorial su Data Management oppure torna su R tutorial.